Dashboard
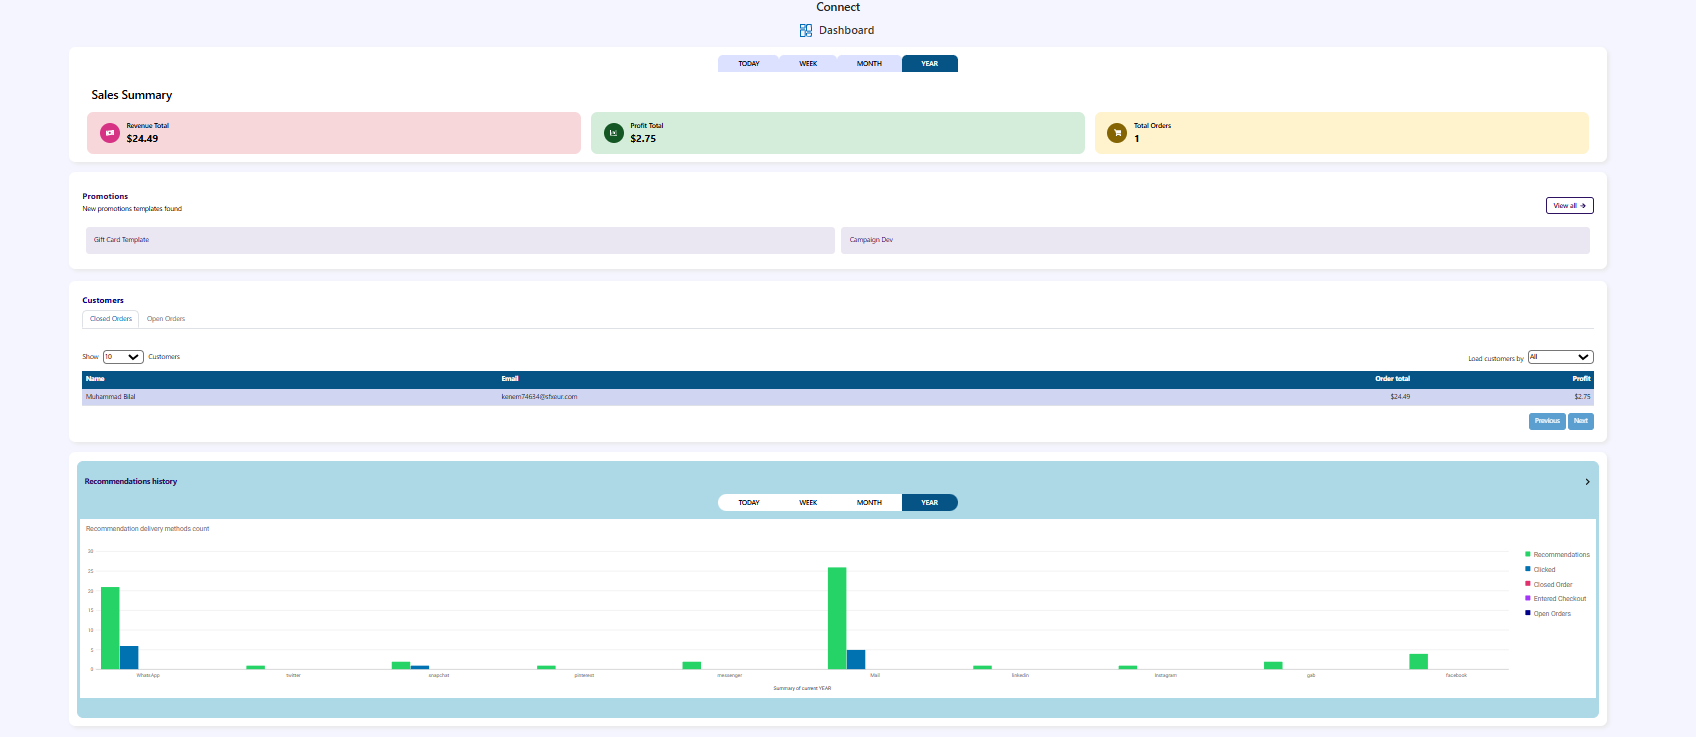
The Dashboard is the central analytics and monitoring interface of the Connect feature. It provides a unified view of business activity, including sales performance, orders, promotions, customer information, and recommendation analytics.
The dashboard enables users to monitor operational performance and customer engagement across different time periods.
1. Dashboard Overview
The Dashboard provides visibility into key operational and business metrics such as:
- Sales performance
- Order activity
- Customer data
- Promotion availability
- Campaign development
- Recommendation activity
All metrics can be viewed across predefined time queues that allow users to analyze performance over different periods.
2. Time Queues
The dashboard includes four time queues that filter all displayed data.
| Queue | Description |
|---|---|
| TODAY | Displays data for the current day |
| WEEK | Displays data for the last seven days |
| MONTH | Displays data for the current month |
| YEAR | Displays data for the current year |
Selecting a queue updates all dashboard components, including sales summary, customer data, orders, and recommendation analytics.
3. Sales Summary
The Sales Summary section provides a quick overview of the business's financial performance for the selected time period.
Revenue Total
Displays the total revenue generated during the selected time range.
Profit Total
Displays the total profit generated from completed sales.
Total Orders
Shows the number of orders placed during the selected time period.
This section allows users to quickly understand overall sales performance and order activity.
4. Promotions
The Promotions section provides access to marketing templates and promotional resources that can be used to create campaigns.
New Promotions Templates Found
Displays newly available promotional templates that can be used for marketing campaigns.
View All
Allows users to open the complete list of available promotion templates.
Gift Card Template
The Gift Card template allows businesses to create gift card promotions that can be offered to customers as part of marketing campaigns or loyalty initiatives.
5. Campaign Development
The Campaign Dev section supports the creation and management of marketing campaigns.
Users can use this area to:
- Plan promotional campaigns
- Target customer groups
- Launch marketing initiatives
- Track campaign-related activity
Campaigns may use available promotion templates and can be linked with customer segments.
6. Orders Overview
The Orders Overview section provides visibility into order statuses within the system.
Closed Orders
Displays the number of orders that have been successfully completed.
Open Orders
Displays orders that are currently active or in progress.
This section helps users monitor order flow and fulfillment activity.
7. Customers Section
The Customers section provides a list of customers along with their purchase activity and contribution to business revenue.
Users can control the number of displayed records.
Example:
Show: 10 customers
8. Customer Filters
Customers can be loaded using the following options:
| Filter | Description |
|---|---|
| All | Displays all customers |
| Name | Search customers by name |
| Search customers by email address |
These filters allow users to quickly locate specific customers within the database.
9. Customers Table
The customers table displays the following information:
| Column | Description |
|---|---|
| Name | Customer's name |
| Customer's email address | |
| Order Total | Total value of orders placed by the customer |
| Profit | Profit generated from the customer's purchases |
This table helps businesses understand customer purchasing behavior and identify valuable customers.
10. Recommendations History
The Recommendations History section displays the activity of the recommendation system over time.
It tracks how customers interact with product recommendations and how those interactions progress toward order completion.
11. Recommendation Metrics
The recommendation history includes the following metrics:
| Metric | Description |
|---|---|
| Recommendations | Number of recommendations shown to customers |
| Clicked | Number of times customers clicked on recommended items |
| Entered Checkout | Customers who proceeded to checkout after interacting with recommendations |
| Open Orders | Orders initiated but not yet completed |
| Closed Orders | Orders that were successfully completed |
12. Time-Based Recommendation Analysis
Recommendation activity can be analyzed across the same time queues used throughout the dashboard:
- TODAY
- WEEK
- MONTH
- YEAR
This allows users to understand how recommendation performance changes over time.
13. Dashboard Purpose
The dashboard is designed to provide businesses with quick and actionable insights. It helps teams monitor performance, analyze customer behavior, and evaluate marketing effectiveness.
By consolidating multiple operational metrics into a single interface, the dashboard enables faster decision-making and improved business visibility.