Metrics
📊 Metrics Documentation
The Metrics module provides data-driven insights into customer purchasing behavior, order trends, and vendor activity. This module is divided into three key sections:
1. 📈 Recommendations
Purpose
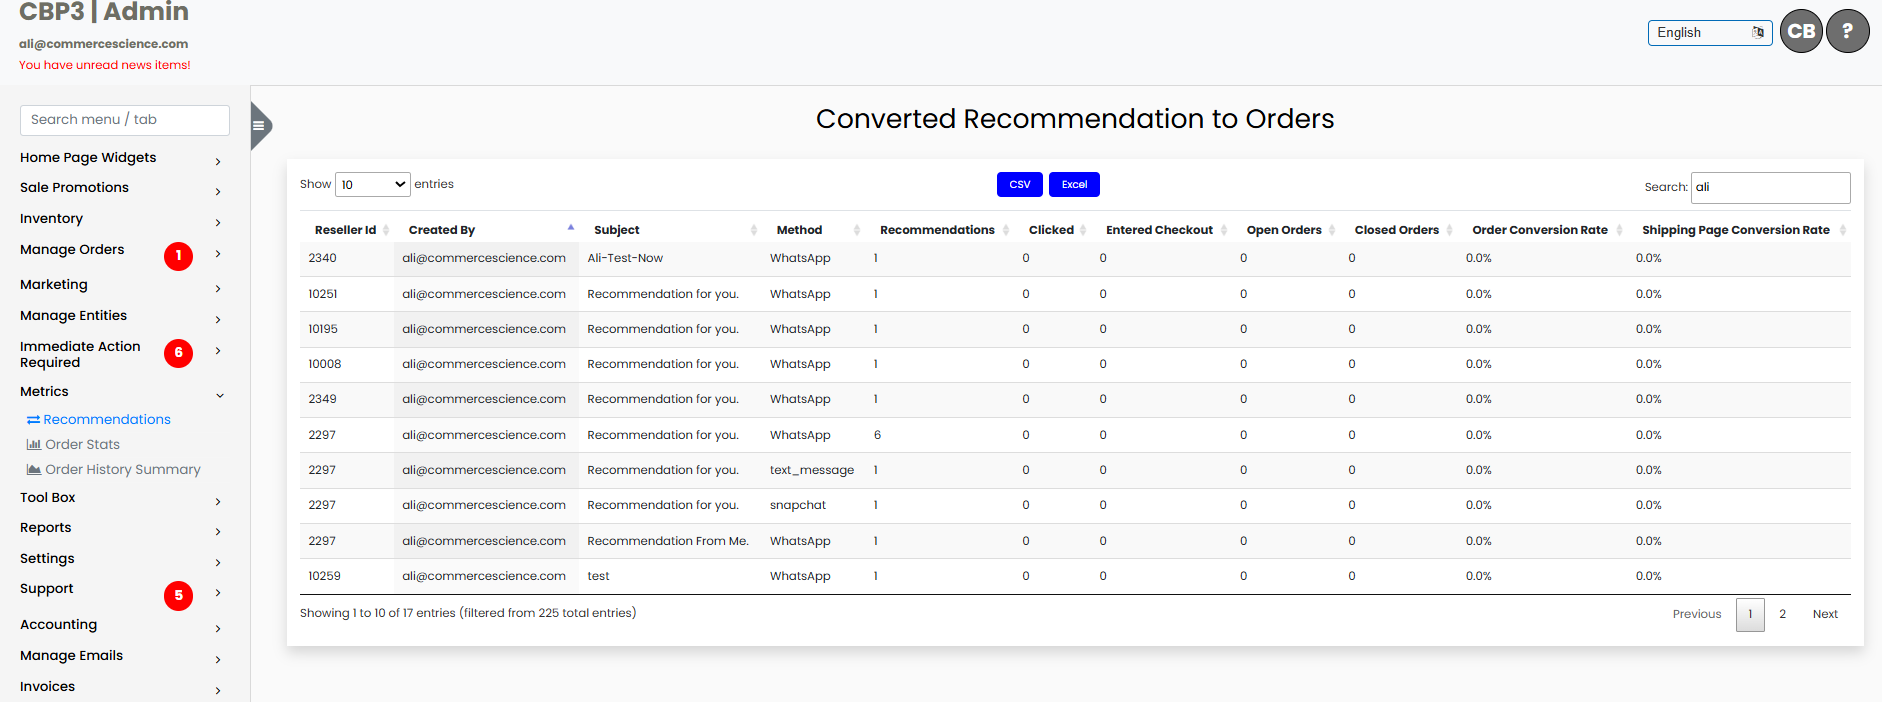
This page displays the conversion of system-generated recommendations into actual orders.
Key Features - View a list of converted recommendations that resulted in real customer orders. - Track the performance of the recommendation engine. - Identify which recommendations led to purchases and which did not.
Data Fields
| Field | Description |
|---|---|
| Reseller ID | Unique identifier for the reseller associated with the recommendation. |
| Created By | The user or system entity that generated the recommendation. |
| Subject | The subject or context of the recommendation (e.g., product category, customer intent). |
| Method | The recommendation method used (e.g., AI-based, manual, rule-based). |
| Recommendations | Total number of recommendations made. |
| Clicked | Number of times recommendations were clicked by customers. |
| Entered Checkout | Number of sessions where customers entered the checkout flow from the recommendation. |
| Open Orders | Number of orders that are still open (not completed). |
| Closed Orders | Number of completed orders resulting from the recommendation. |
| Order Conversion Rate | Percentage of recommendations that led to completed (closed) orders. Formula: (Closed Orders / Recommendations) × 100 |
| Shipping Page Conversion Rate | Percentage of users who reached the shipping page after clicking a recommendation. Formula: (Entered Checkout / Clicked) × 100 |
2. 📊 Order Stats
Purpose
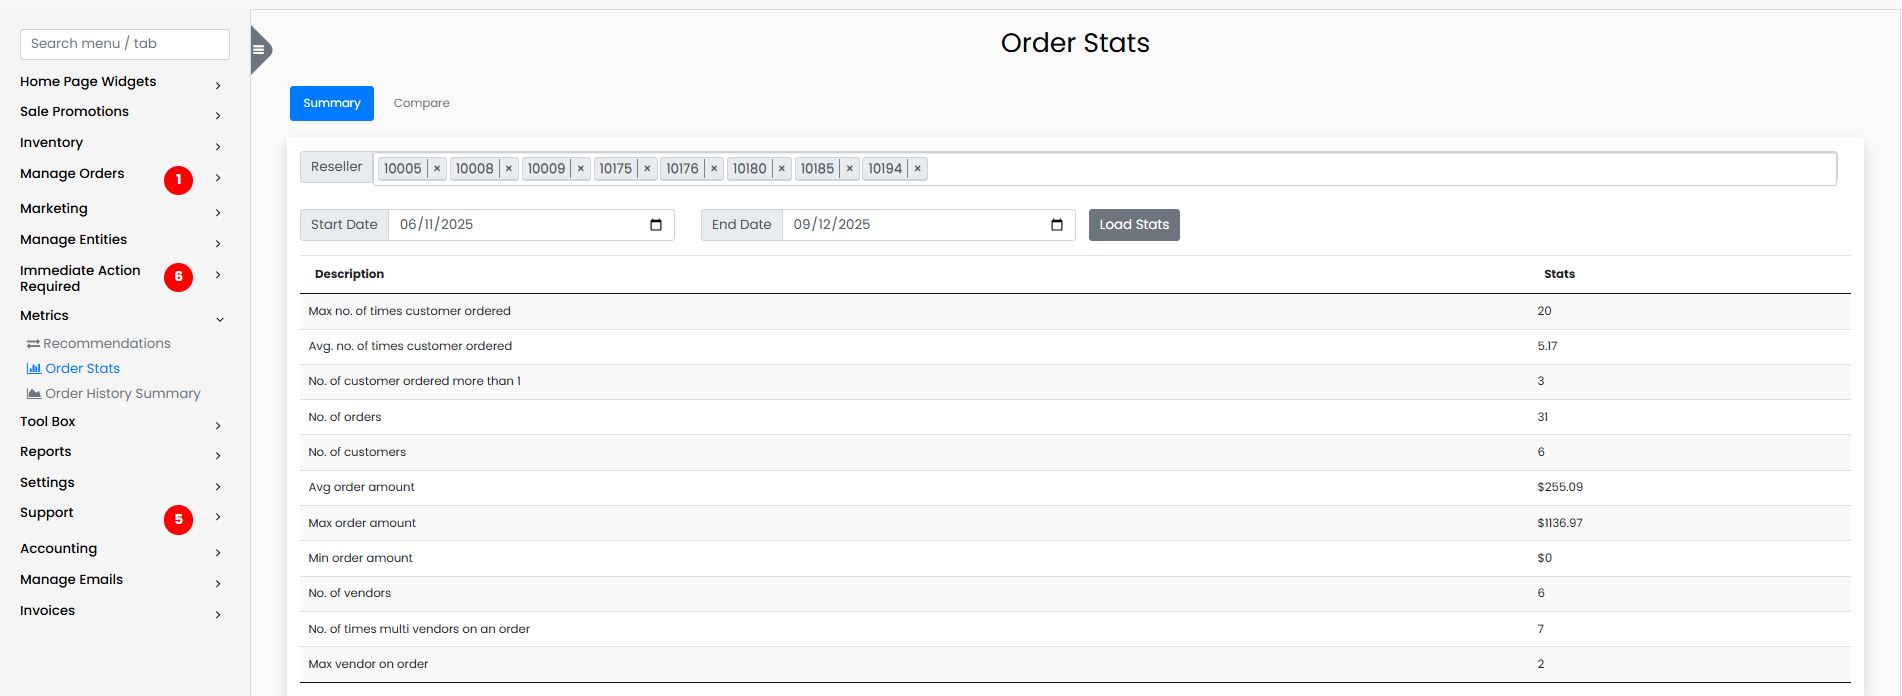
Provides a statistical summary of customer order behavior across resellers.
Customer Order Insights (Per Reseller)
| Metric | Description |
|---|---|
| Max number of times a customer ordered | The highest number of orders placed by a single customer. Example: 26 |
| Average number of times a customer ordered | Average number of repeat orders per customer. Example: 6.17 |
| Number of customers who ordered more than once | Shows loyalty and retention. Example: 3 |
| Total number of orders | Total count of all orders placed. Example: 37 |
| Total number of customers | Unique customers who placed orders. Example: 6 |
Order Amount Analysis
| Metric | Description |
|---|---|
| Average order amount | Mean value of all order totals. Example: $236.70 |
| Maximum order amount | Highest value among all orders. Example: $1136.97 |
| Minimum order amount | Lowest value among all orders. Example: $0 |
Vendor Involvement
| Metric | Description |
|---|---|
| Number of vendors | Total unique vendors involved in the orders. Example: 7 |
| Number of times multiple vendors in a single order | Shows how often customers purchase from multiple vendors in one order. Example: 8 |
| Maximum vendors in a single order | Indicates highest vendor diversity in one order. *Example: [To be provided] |
3. 🧾 Order History Summary
Purpose
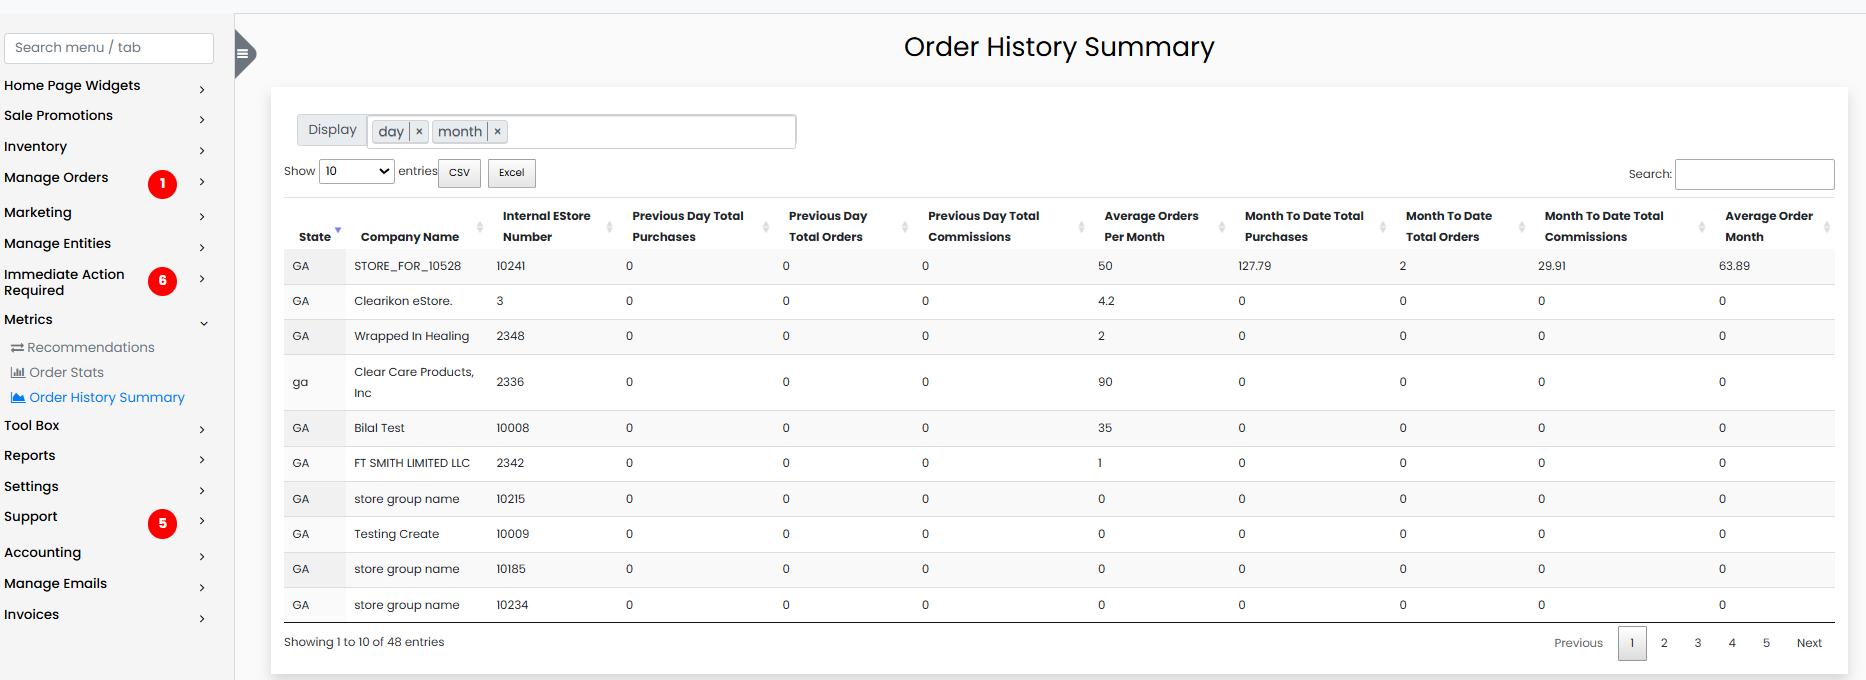
Track daily, monthly, and yearly summaries of orders and purchases by company name.
Time-Based Filters
View data by: - Day - Month - Year
Metrics Per Company
| Metric | Description |
|---|---|
| Company Name | Name of the customer company |
| Previous Day - Total Purchases | Sum of all purchases made yesterday |
| Previous Day - Total Orders | Count of all orders placed yesterday |
| Previous Day - Total Commissions | Commission earned from yesterday’s transactions |
Notes
- All metrics are updated in real-time or daily depending on system configuration.
- Currency formatting is based on USD unless specified otherwise.
- Zero-value orders may indicate test transactions or promotional orders.
- Historical comparisons are available in the Order History Summary via time filters.